
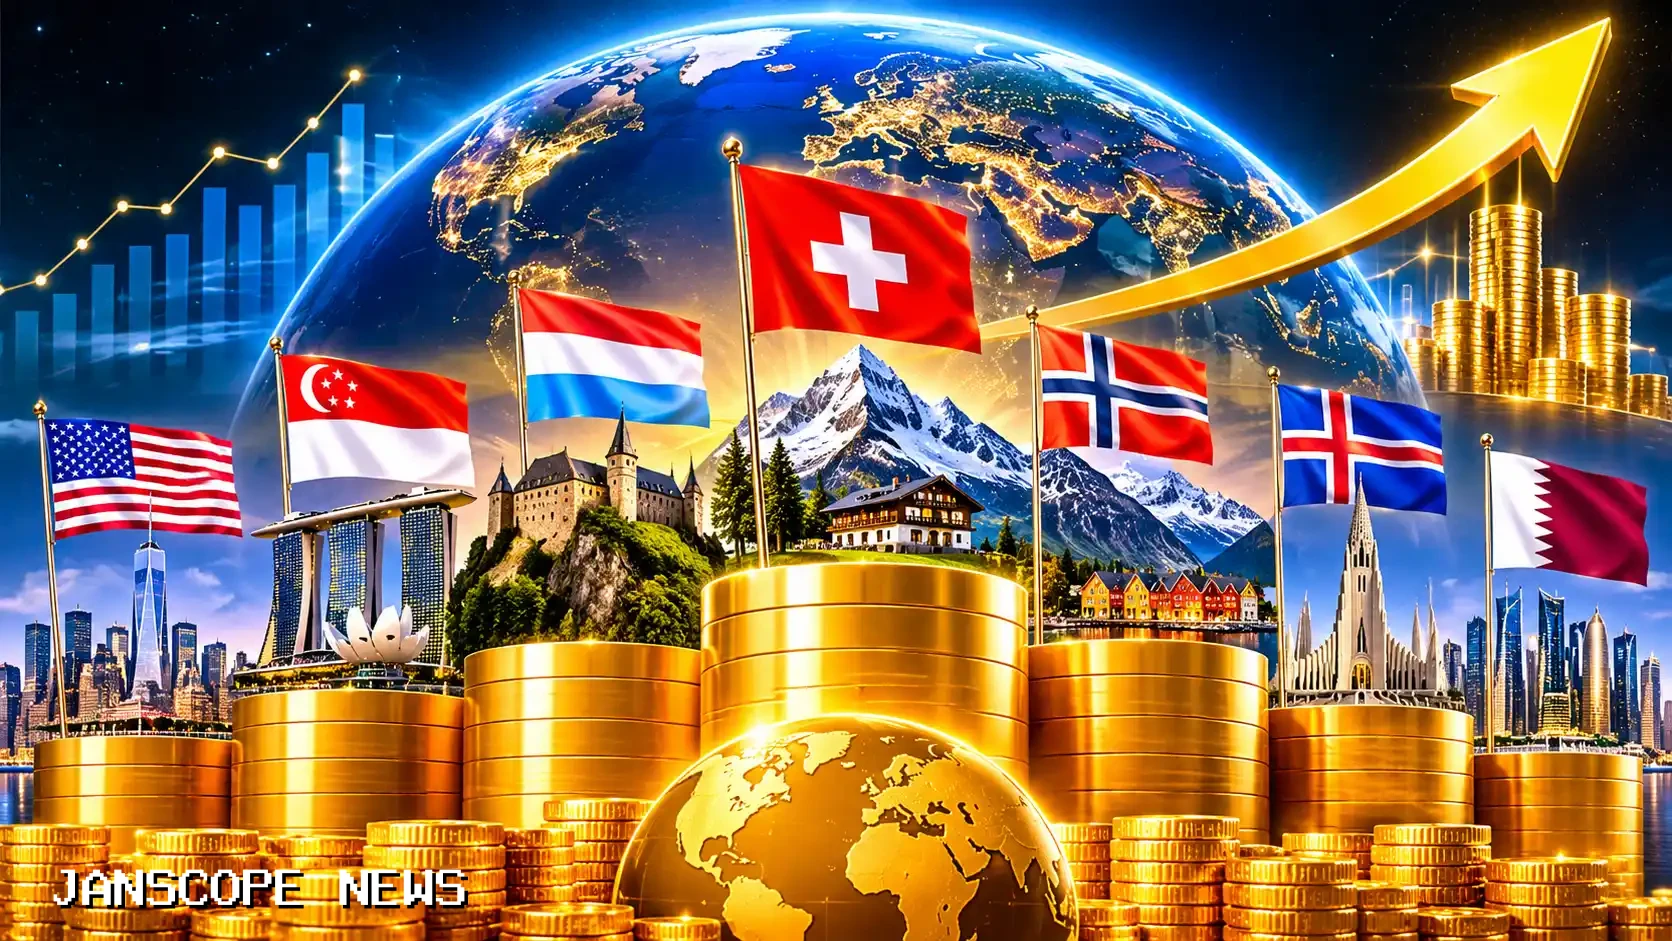
Richest countries by GDP per capita: 2026 rankings and what the numbers hide
The richest countries by GDP per capita in 2026 are Liechtenstein ($230,417 nominal), Luxembourg ($155,733), Ireland ($127,837), and Switzerland ($124,478), based on the International Monetary Fund World Economic Outlook database. When adjusted for purchasing power parity (PPP) to account for local prices, Liechtenstein ($198,987) and Singapore ($176,927) take the top two spots globally.
Most people read a GDP per capita table as a leaderboard of where the wealthiest citizens live. That is the quickest way to misread global economic data. Gross domestic product per head simply divides the total market value of goods and services produced inside a nation's borders by its full-time resident population. In major economies like the United States or Germany, that ratio tracks living standards reasonably well. In small financial hubs, corporate tax havens, and microstates, the math breaks down. Before looking at who sits at the top in 2026, you have to know whether you are looking at raw exchange rates or local buying power.
Top 15 richest countries by GDP per capita in 2026 (nominal vs PPP)
A country's ranking shifts dramatically depending on whether you measure output in nominal US dollars or international dollars adjusted for purchasing power parity (PPP). The table below compares the top 15 sovereign nations and major jurisdictions from the October 2026 IMF data, alongside microstates tracked by the World Bank GDP per capita indicator.
| Country | 2026 Nominal (USD)∣2026PPP(Int.) | Primary Economic Driver |
|---|---|---|
| Liechtenstein | $230,417 | $198,987 |
| Luxembourg | $155,733 | $156,638 |
| Ireland | $127,837 | $149,642 |
| Switzerland | $124,478 | $106,944 |
| Norway | $115,188 | $116,169 |
| Singapore | $109,117 | $176,927 |
| Iceland | $107,464 | $83,000 |
| United States | $95,212 | $95,212 |
| Denmark | $82,714 | $92,880 |
| Netherlands | $78,540 | $88,200 |
| Macao SAR | $77,050 | $141,440 |
| Australia | $75,170 | $75,040 |
| Israel | $72,440 | $60,100 |
| San Marino | $70,660 | $87,520 |
| Qatar | $63,634 | $103,804 |
Monaco and Bermuda sit even higher in nominal terms when included, with World Bank figures placing Monaco near $288,000 and Bermuda at $142,250. The IMF excludes Monaco from its standard World Economic Outlook tables because of its tiny population and fiscal union with France.
Why nominal GDP per capita and PPP tell two different stories
If you want to know how much financial weight an individual carries on the international market, use nominal GDP per capita. It converts a country's economic output into US dollars using current market exchange rates. When a Swiss engineer buys an iPhone, books a hotel in Tokyo, or invests in US equities, nominal dollars measure their actual reach.
Nominal figures fail when you want to know how comfortably people live inside their own borders. A haircut, an apartment lease, or a bus ticket in Zurich costs far more than the exact same service in Doha or Taipei.
Purchasing power parity fixes this by pricing a standardized basket of goods and services across every country, expressed in current international dollars. Notice what happens to Switzerland and Singapore in the 2026 rankings. In nominal terms, Switzerland ($124,478) outranks Singapore ($109,117) by more than $15,000. Once you apply the PPP adjustment, Switzerland drops to 106,944 international dollars because domestic prices are exceptionally high, while Singapore jumps to 176,927 international dollars thanks to state-subsidized public housing, low tax rates, and lower domestic service costs. Qatar shows the same pattern, jumping from $63,634 in nominal output to 103,804 international dollars under PPP because domestic energy, utilities, and labor are inexpensive.
Three statistical distortions that inflate the top rankings
Looking at a per-capita GDP table without understanding national accounting rules leads to bad conclusions. The top four countries on the 2026 list all benefit from structural quirks that separate recorded economic output from what local households actually earn.
1. The cross-border commuter effect (Liechtenstein and Luxembourg)
GDP counts everything produced inside a country's geographic borders (the numerator) and divides it by the people who sleep there at night (the denominator). It does not divide by the people who actually do the work.
Liechtenstein has roughly 40,000 residents, yet more than half of its workforce commutes daily from neighboring Switzerland and Austria. Those commuters staff the factories making precision dental equipment and the private banks managing global wealth. Their daily output goes straight into Liechtenstein's GDP, but when they drive home at 5:00 PM, they are excluded from the population count.
Luxembourg operates on the exact same math. Roughly 220,000 cross-border workers travel in from France, Belgium, and Germany every morning to run the country's massive investment fund industry. They generate a huge share of Luxembourg's $110.4 billion economy in 2026, inflating the per-capita number to $155,733 for the 670,000 permanent residents.
2. Multinational profit shifting and "Leprechaun economics" (Ireland)
On paper, Ireland is richer per person than Switzerland, Norway, and the United States. Walk down a street in Dublin or Cork, and you will quickly see that infrastructure and household budgets do not match a $127,837 per-capita economy.
Because of Ireland's corporate tax structure and English-speaking workforce, giant US technology and pharmaceutical companies house their valuable intellectual property (patents, software licenses, and drug formulas) inside Irish subsidiaries. When a patent registered in Dublin generates global royalties, or when contract manufacturers abroad produce goods tied to Irish-held IP, the revenue and depreciation book directly into Ireland's GDP. Most of that money belongs to foreign shareholders and never touches an Irish bank account or pay stub.
The distortion grew so large that Ireland's Central Statistics Office (CSO) had to invent a completely separate metric called Modified Gross National Income, or GNI*. GNI* strips out the depreciation of foreign-owned intellectual property, aircraft leasing operations, and the profits of redomiciled corporations. In the CSO's latest full-year national accounts release (published July 2026 covering 2025), Ireland's headline GDP was €602.4 billion, or €110,365 per person. Once the CSO applied the GNI* filter, actual domestic economic income dropped to €334.0 billion, or €61,182 per person. Nearly 45% of Ireland's headline GDP is phantom accounting.
3. Resource booms with small populations (Guyana, Qatar, and Norway)
When massive oil or natural gas reserves are divided among a tiny population, GDP per capita skyrockets overnight. The clearest example in 2026 is Guyana. Ten years ago, Guyana was one of the poorest countries in South America. Following massive offshore oil discoveries in the Stabroek Block by a consortium led by ExxonMobil, Guyana's PPP GDP per capita hit 98,912 international dollars in 2026, ranking 8th among sovereign countries globally and ahead of the United States (95,212).
Does the average Guyanese household live better than the average American household in 2026? Not remotely. Foreign oil companies take a large share of initial production revenues to recover capital costs, and building hospitals, roads, and wage growth takes decades.
Contrast Guyana with Norway ($115,188 nominal; $116,169 PPP). Norway also pumps huge volumes of offshore oil and gas for a population of just 5.5 million, but it routes state petroleum revenues into the Government Pension Fund Global (its $1.7+ trillion sovereign wealth fund) and taxes high earners heavily to fund universal public services. In Norway, the per-capita figure reflects genuine institutional and household wealth; in newer petro-states, it often reflects extraction volume.
Richest countries by continent in 2026
Global top-10 lists are crowded with European microstates and Asian city-states, which hides who actually leads each region of the world. If you break the October 2026 IMF nominal figures down by continent, the regional leaders look very different:
- Europe: Liechtenstein ($230,417) and Luxembourg ($155,733) lead overall, while Switzerland ($124,478) and Norway ($115,188) lead among economies with populations over five million.
- Asia: Singapore ($109,117 nominal; $176,927 PPP) is first by a wide margin, followed by Macao SAR ($77,050), Israel ($72,440), Qatar ($63,634), and Hong Kong SAR ($60,320).
- North America: The United States ($95,212) leads sovereign nations, ahead of Canada ($60,110). If British Overseas Territories are counted, Bermuda ($142,250) and the Cayman Islands ($104,290) sit higher due to offshore insurance and fund registration.
- Oceania: Australia ($75,170) ranks first, comfortably ahead of New Zealand ($51,040).
South America: Guyana ($38,570 nominal; $98,912 PPP) has surged past traditional regional leaders Uruguay ($27,340 nominal; $39,010 PPP) and Chile ($19,960 nominal; $37,010 PPP) due to offshore crude production.
Africa: Seychelles ($19,160 nominal; $37,180 PPP) and Mauritius ($13,670 nominal; $35,430 PPP) top the continent, driven by high-end tourism, maritime trade, and offshore financial services.
Largest economies vs richest countries: why China and India rank lower
One of the most frequent points of confusion in economics is the gap between a large economy and a rich country. Total GDP measures the sheer size and geopolitical weight of a nation's output; GDP per capita measures intensity per resident.
In 2026, the world's six largest economies by total nominal GDP are the United States ($32.64 trillion), China ($21.55 trillion), Germany ($5.47 trillion), Japan ($4.34 trillion), the United Kingdom ($4.27 trillion), and India ($4.06 trillion).
Among those six economic superpowers, only the United States cracks the top 15 in GDP per capita, sitting at 11th overall ($95,212). Because China divides its $21.55 trillion output across 1.4 billion citizens, its nominal GDP per capita in 2026 is $15,370 (ranking 93rd globally, or $31,790 in PPP). India's $4.06 trillion economy divided across more than 1.4 billion people puts its per-capita figure near $2,800 nominal. Even Germany ($65,700, ranked 22nd), the United Kingdom ($61,110, ranked 25th), and Japan ($35,400, ranked 53rd, dragged down by a weaker yen) sit far behind small specialized economies like Denmark or Iceland.
Better metrics if you want to measure actual household wealth
If you are evaluating countries for relocation, market expansion, or living standards, never rely on GDP per capita alone. Pair it with three practical indicators that strip out corporate and demographic noise:
- Gross National Income (GNI) per capita (and GNI for Ireland):* GNI tracks the income actually earned by a country's residents, regardless of where it was produced, and subtracts profits sent back to foreign headquarters. It immediately corrects for Luxembourg's commuters and Ireland's tech multinationals.
Actual Individual Consumption (AIC) per capita: Used heavily by Eurostat and the OECD, AIC measures the goods and services households actually consume, whether they paid for them out of pocket (like US healthcare) or received them via government taxes (like Scandinavian healthcare and education).
Median wealth and disposable household income: GDP is a mathematical mean. If one billionaire moves into a village of 99 broke residents, the per-capita average shoots up while nobody else gets richer. Median net worth (tracked in the UBS Global Wealth Report) and OECD net adjusted disposable income show what the person in the exact middle of the income distribution takes home after taxes and transfers.
Frequently asked questions about GDP per capita rankings
What is the #1 richest country in the world by GDP per capita in 2026?
Among countries tracked by the IMF in October 2026, Liechtenstein ranks first in the world in both nominal GDP per capita ($230,417) and PPP-adjusted GDP per capita (198,987 international dollars). If microstates tracked separately by the World Bank are included, Monaco holds the highest nominal figure at roughly $288,000 per resident.
Why is Singapore richer than the United States in PPP GDP per capita?
In nominal US dollars, Singapore ($109,117) is ahead of the United States ($95,212) by about $14,000 in 2026, but in PPP terms Singapore ($176,927) nearly doubles the US figure. Singapore produces massive high-value exports in semiconductors, refined chemicals, and wealth management across a compact city-state of six million people, while keeping domestic healthcare, food, and public housing costs lower relative to total output than the US.
Why does Qatar have such a high GDP per capita?
Qatar holds the world's third-largest natural gas reserves and is a massive exporter of liquefied natural gas (LNG). Because those multi-billion-dollar hydrocarbon revenues are divided across a total resident population of roughly 3 million people (only about 350,000 of whom are Qatari citizens), the per-person output reaches $63,634 nominally and $103,804 in PPP.
Is GDP per capita the same as average salary?
No. GDP per capita includes corporate profits, government spending, capital depreciation, and foreign trade surpluses alongside employee wages. In almost every country, average and median annual salaries are substantially lower than the headline GDP per capita figure.
How did Guyana enter the top 10 richest countries by PPP GDP per capita?
Guyana discovered more than 11 billion barrels of recoverable oil and gas reserves offshore beginning in 2015. As new floating production vessels came online through 2025 and 2026, crude oil exports pushed the country's PPP GDP per capita to 98,912 international dollars across a small population of roughly 815,000 people.
Why did Japan's nominal GDP per capita drop below $40,000?
Japan's 2026 nominal GDP per capita is $35,400 (ranking 53rd), largely because of currency exchange rates rather than a sudden collapse in domestic living standards. A weaker Japanese yen against the US dollar shrinks Japan's output when converted to nominal USD; when measured in PPP, Japan's per-capita figure is 59,710 international dollars.
Which country has the highest real wages after taxes?
When corporate distortions are removed and wages are measured directly, Switzerland, Luxembourg, Iceland, the United States, and Denmark consistently record the highest average full-time annual wages according to OECD employment data.
How often are global GDP per capita rankings updated?
The International Monetary Fund updates its World Economic Outlook database twice a year, in April and October, combining historical national accounts with current-year projections. The World Bank updates its global development indicators annually, usually in mid-year, using finalized prior-year national data.
For a visual comparison of how individual country projections shift through the end of the decade, watch this Richest Countries in the World by GDP per Capita breakdown, which maps out the IMF's multi-year per-capita forecast across major economies.



No comments yet — be the first to share your thoughts!